
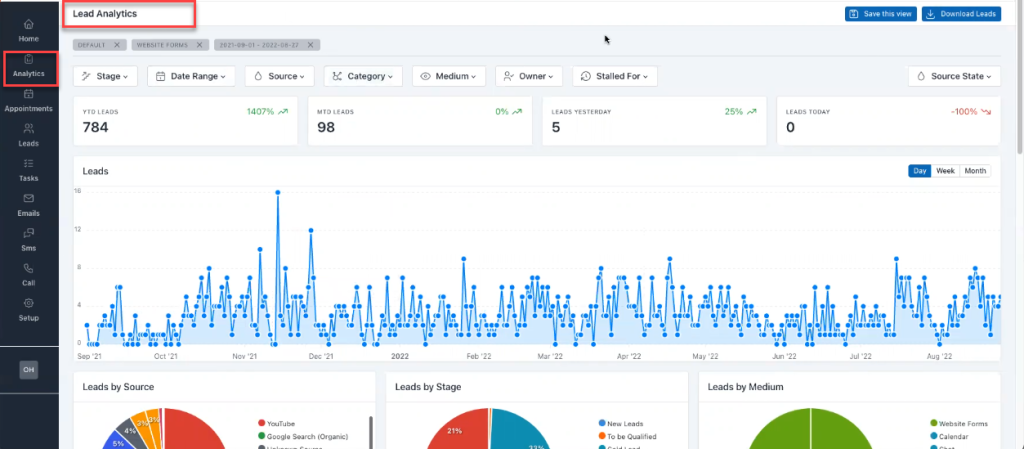
LeadCentre.AI Lead Analytics analyses and tracks lead-related information. Lead generation analytics especially helps to track website activity such as the number of leads generated, a graphical view of the leads generated, leads by source/stage/medium in a pie-chart format, and detailed information of Leads by Source/Stage.
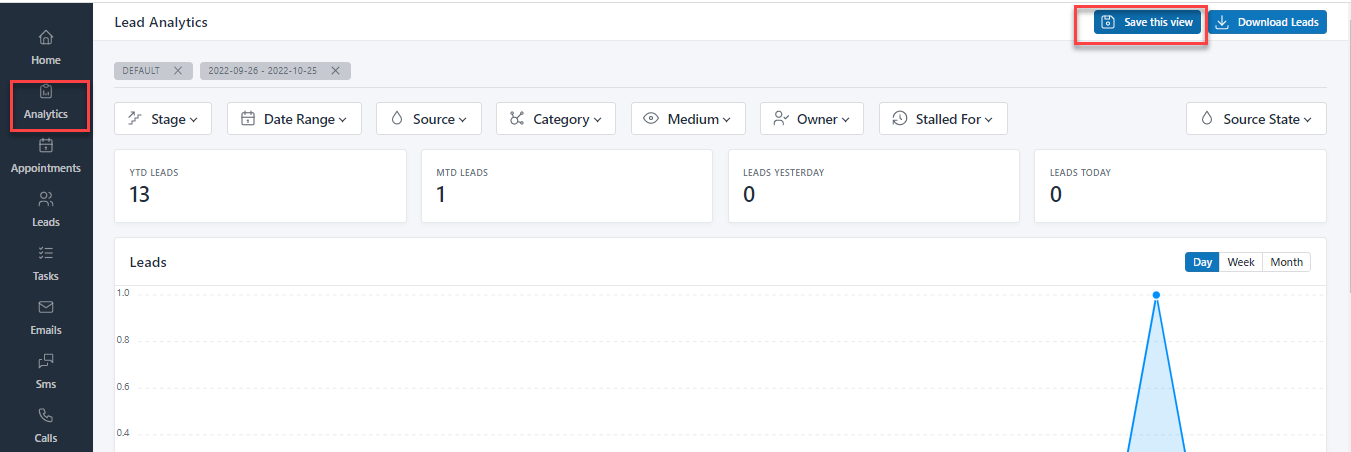
To view the Lead Analytics page, on LeadCenter.AI, go to Analytics.
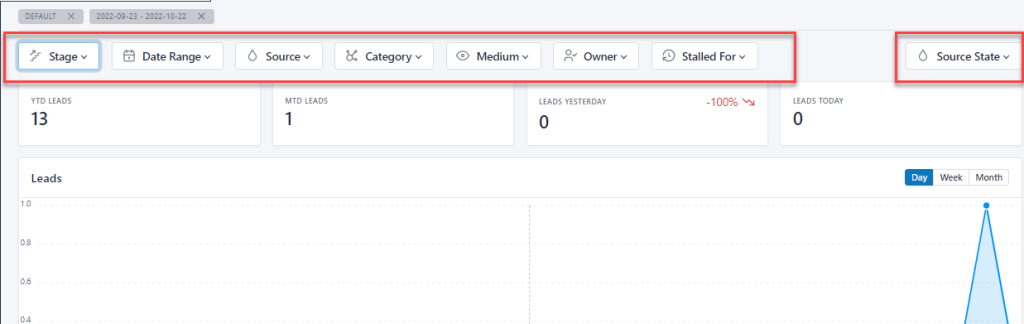
The Filter Options in LeadCenter.AI analytics lets you view the lead analytics by using the various filter options. It consists of the following filter options; Stage, Data Range, Source, Category, Medium, Owner, Stalled For, and Source State.
To filter the data click on the drop-down arrow for each filter option.
The Lead Generation Data section displays the number of leads generated yearly, monthly, weekly, and daily.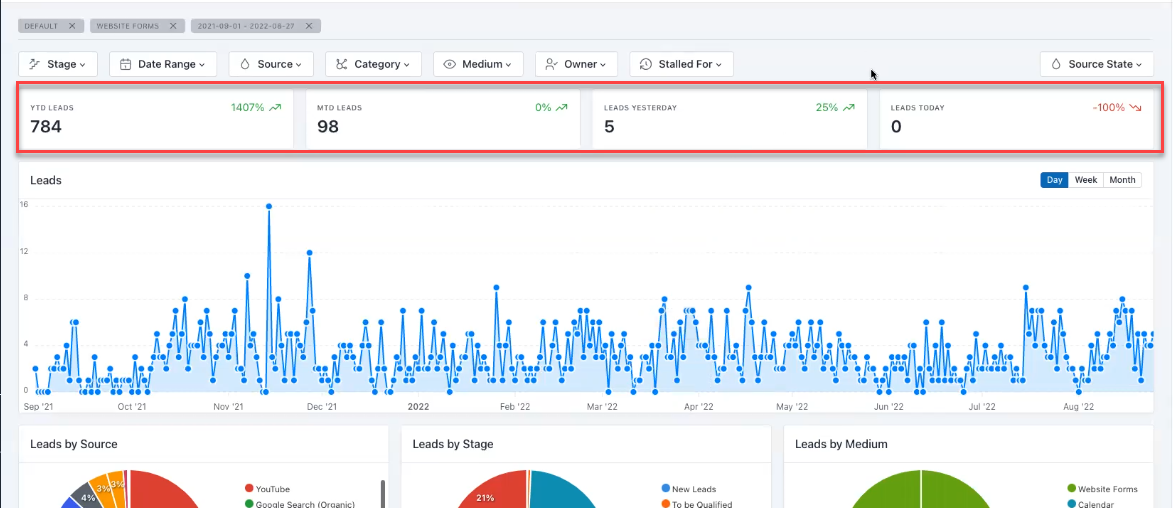
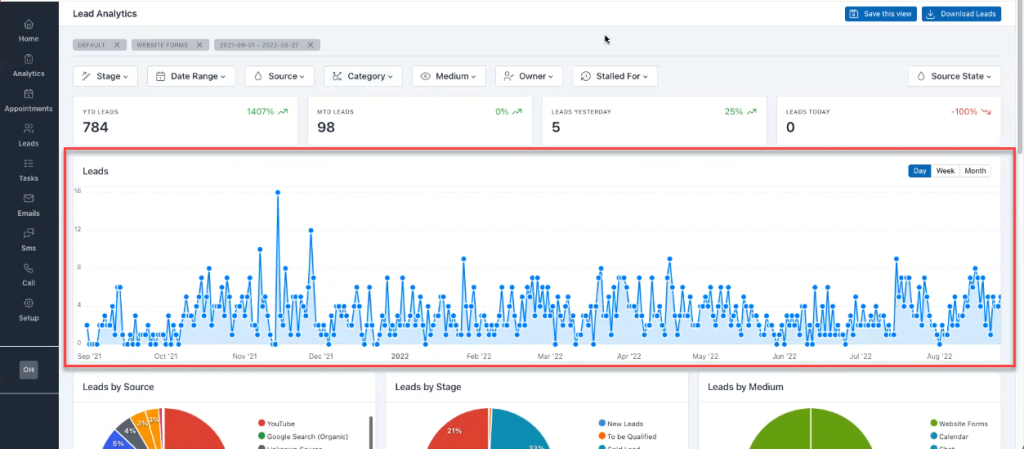
In LeadCentre.AI, Lead generation information can also be viewed in a graphical format, based on month, week, and daily generation details.
The Y-axis lists the number of leads generated and the X-axis lists each month, which provides the number of leads generated each month.
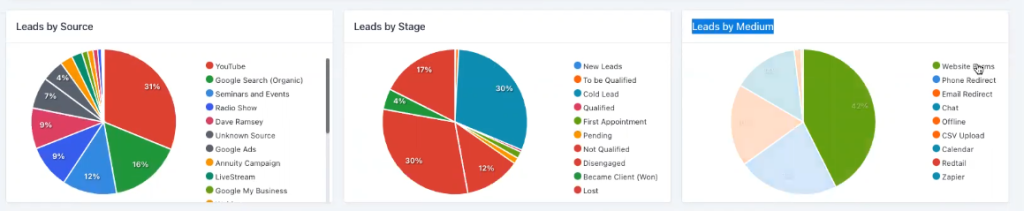
In LeadCentre.AI, the generated leads are displayed in a pie-chart representation. All the lead generation for various sources, stages, and mediums, are displayed in different colors along with the percentage.
It is shown for;
In LeadCentre.AI, a tabular view of leads by Source/Stage is displayed. The table row consists of the Sources and the table column consists of the various lead Stages.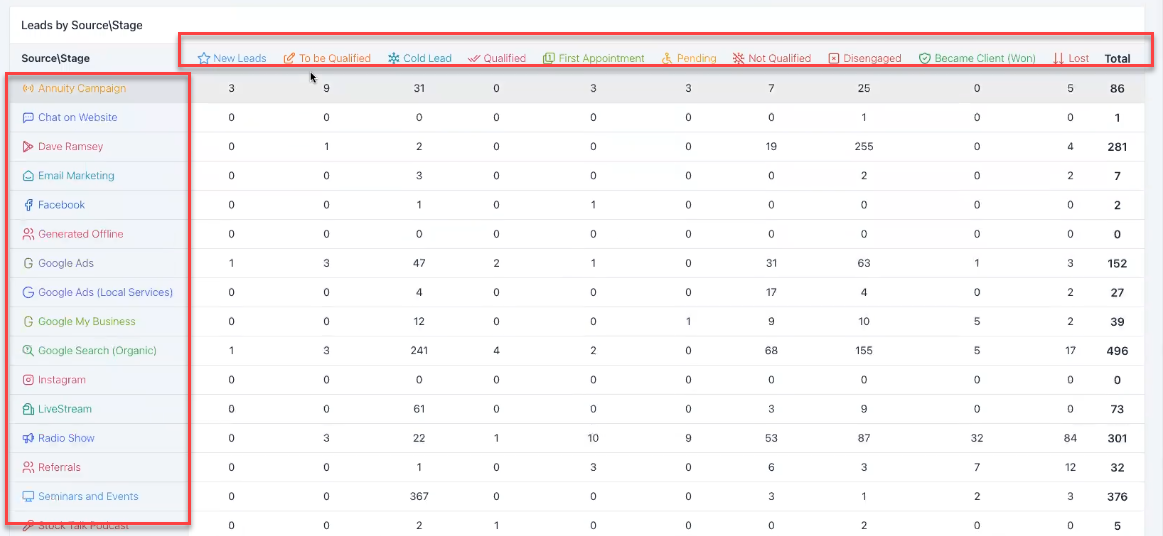
For Example; Youtube is a source and the leads generated through Youtube are in which stage, along with the total number of leads generated through that particular source is displayed.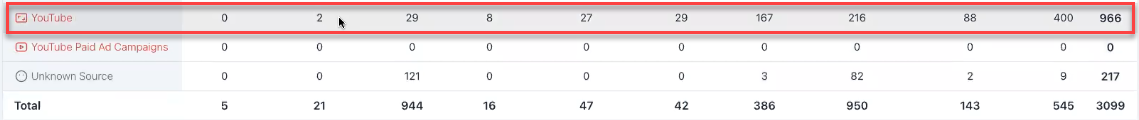
Users can perform download leads and save the view operations from the Lead Analytics page.
For more details on downloading leads see; Downloading Leads to Microsoft Excel.
Saving the View operation helps you to filter data and save a particular view on your Lead Analytics page. Users can go to different sections and always come back and view the saved view on the Lead Analytics page.
To save a view; do the following:
The detailed information of all the leads can be downloaded in an excel format from the Orxy Cloud Leads Management page. By default you can download Top 5000 (Newest First) Lead information.
To download leads in an excel format, do the following;
